

by Andrew Wuensche and Chris Langton
An exhibit entitled "Complexity in Small Universes" by Chris Langton and Andrew Wuensche, was featured in an exhibition of art connected with science, entitled, "Objective Wonder: Data as Art", held at the Rotunda Gallery, Memorial Student Union, University of Arizona, March 4 - April 1, 1999.
The pieces exibited (shown below) illustrate the notions of order-complexity-disorder in Cellular Automata, with images created with DDLab.
This was part of a series of events, the Merged Realities Exposition'99.
Chris Langton and Andrew Wuensche spoke at the Merged Realities Symposium, artists and scientists in a discussion at the crossroads of two cultures, March 4-6, 1999, at the Modern Languages Auditorium, University of Arizona.
The images exhibited are shown below.
back to the DDLab home page, DDLab Gallery
Space-Time Portraits: Order-Complexity-Disorder
Complexity is bounded by Order and Disorder. As scientists, we have
explored the nature of the relationship between these different regimes
of behavior using small formal universes. There is a remarkable
aesthetic quality to the relationship, which we illustrate here.
The universes we explore consist of 1-Dimensional lattices known
as Cellular Automata (CA). Each "cell" in the lattice changes its
state according to a "local" physics, which means that its state at the
next time-step will be a function of its own current state and the
states of its immediate neighbors.
The first four pieces of this collection illustrate, respectively,
Space-Time portraits, Basin of Attraction Fields, Basin-Sub-Tree
portraits, and In-degree Histograms for Ordered, Complex, and Disordered
CA.
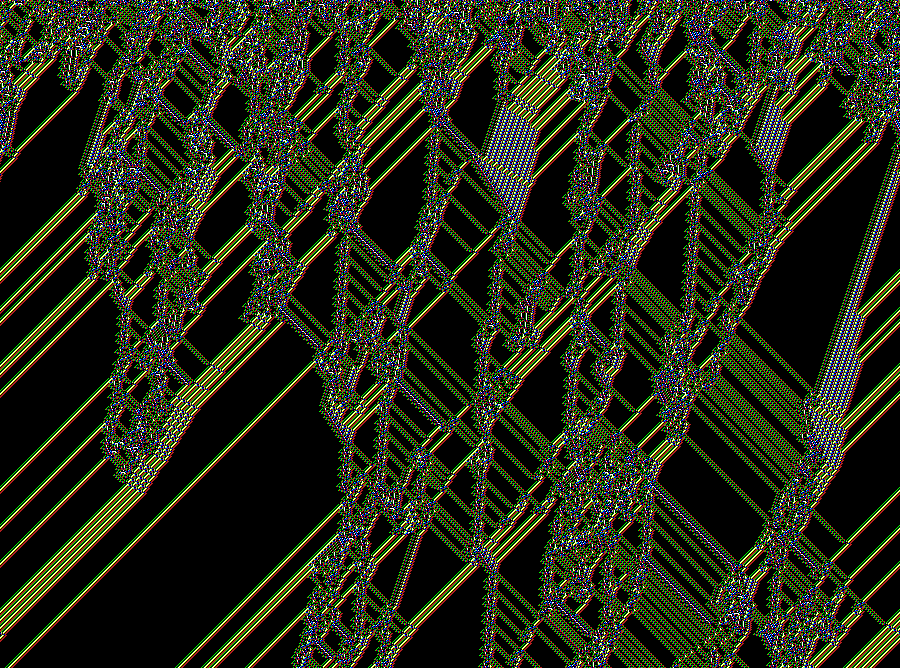
The "Space-Time" portraits show these universes evolving in
time. Space extends horizontally, and successive states of the
1D-universe in time are plotted vertically. Thus, scanning down a
Space-Time portrait, one sees the time-history of a small binary
universe, where a cell's color depends on its neighborhood.
Starting with random initial states, ordered CA quickly settle
to stationary or repetitive patterns. Disordered CA do not settle for a
very long time. In between order and disorder, a rare physics
exists which self-organizes patterns to produce complex interacting
structure. These are emphasized by "filtering" their background pattern.
The "Basin" portraits are graphs which represent the logical
structure of the physics underlying the dynamic behavior exhibited in
the Space-Time portraits. They show the "flow" between states of the
universes. Each point in a Basin-portrait is a complete state of the
universe (a whole 1D spatial slice at a particular point in time). These
points constitute the nodes in a graph, in which each node has one and
only one successor, which is the state of the universe that follows it
at the next time-step under the local, deterministic physics. Although
each node has only one successor, a node may have any number of nodes as
predecessors, anywhere from 0 to a very high number. In general, the
physics underlying Ordered CA are represented by highly convergent
graphs, those underlying Complex CA by less convergent graphs, and those
underlying Disordered CA by very weakly convergent graphs.
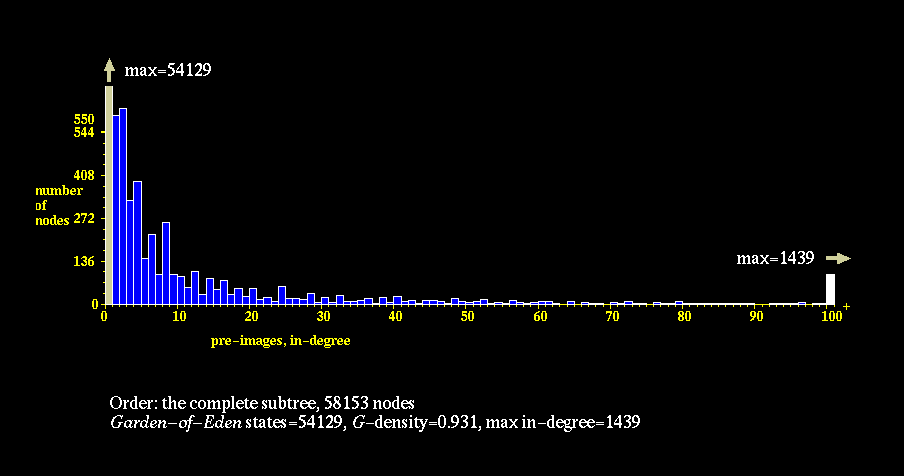
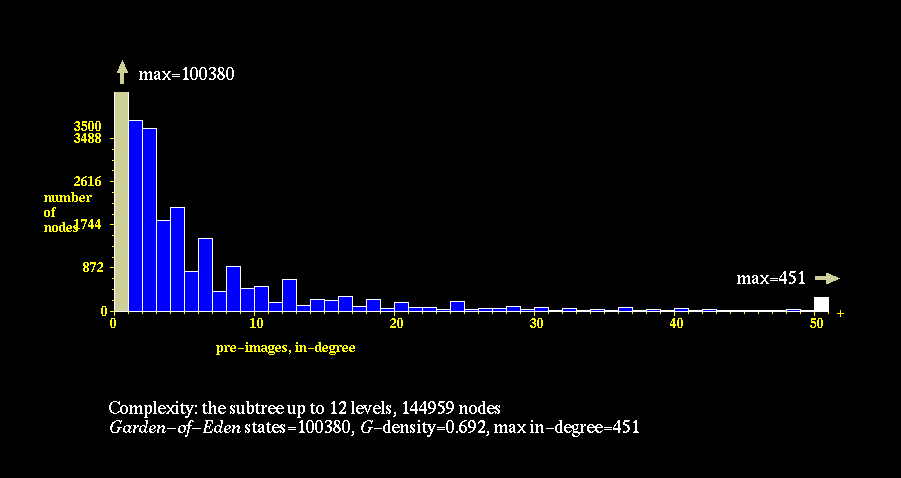
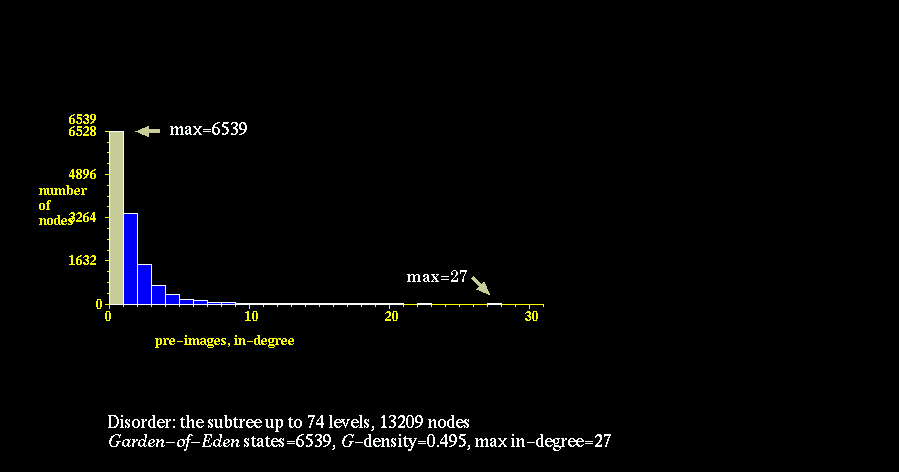
The In-degree Histogram plots measure the degree of convergence of a
physic's graph, and therefore measure the tendency of the CA to Ordered,
Complex, or Disordered behavior. These histograms show the distribution
of nodes with 0, 1, 2, ....., N immediate predecessors under the
physics. Highly Ordered CA tend to have a few states which many, many
other states relax to, hence they have many nodes with high "in-degree."
As a consequence, such graphs also have many nodes with no predecessors
under the physics, so called "Garden of Eden" states. Highly Disordered
CA, on the other hand, have very low convergence, hence they have many
nodes with low "in-degree."
Thus, Ordered CA graphs are extremely bushy, while Disordered CA
graphs are more chain-like, with occasional branch-merging. Complex CA
graphs exhibit bushiness in between the other two classes.
The other pieces in this collection show, respectively, a very long
time-history for a Complex CA; detailed blow-ups of small areas within
Complex CA; and attractor-graphs, "basins of attraction", for a
different set of Ordered, Complex, and Disordered CA.
These portraits were generated by the Discrete Dynamics Lab software
package, written by Andrew Wuensche.
For more information see the
DDLab home page
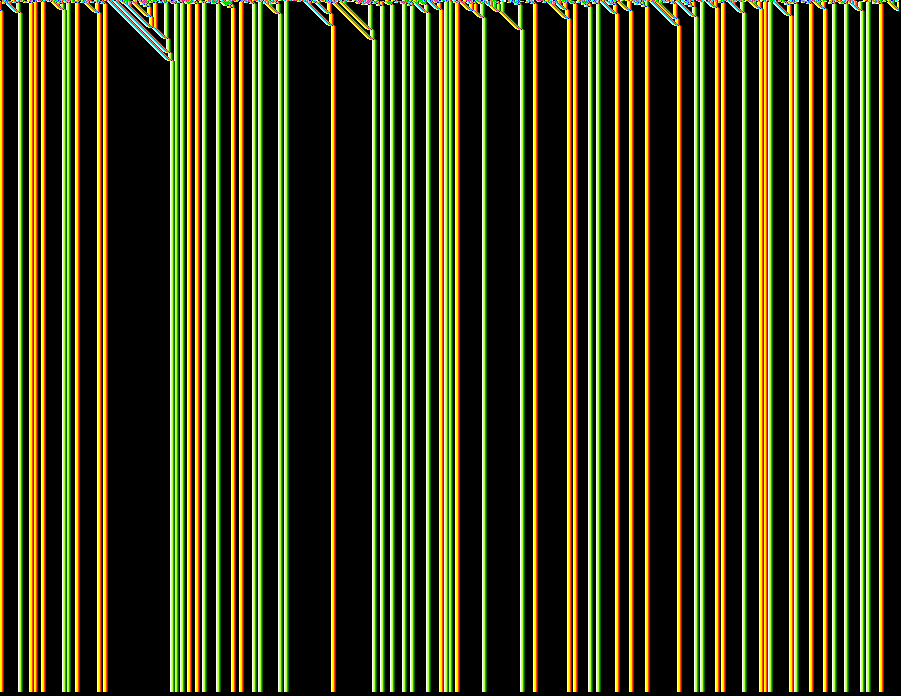
ORDER: space-time patterns, k5 rule o1dc3610n=900
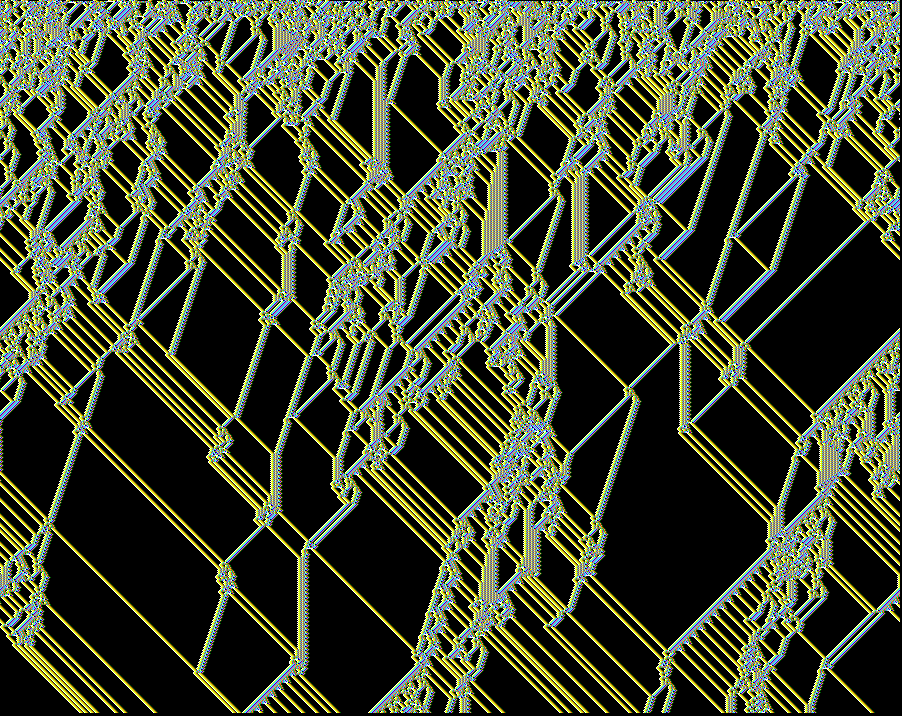
COMPLEXITY: space-time patterns, k5 rule 6c1e53a8, n=900
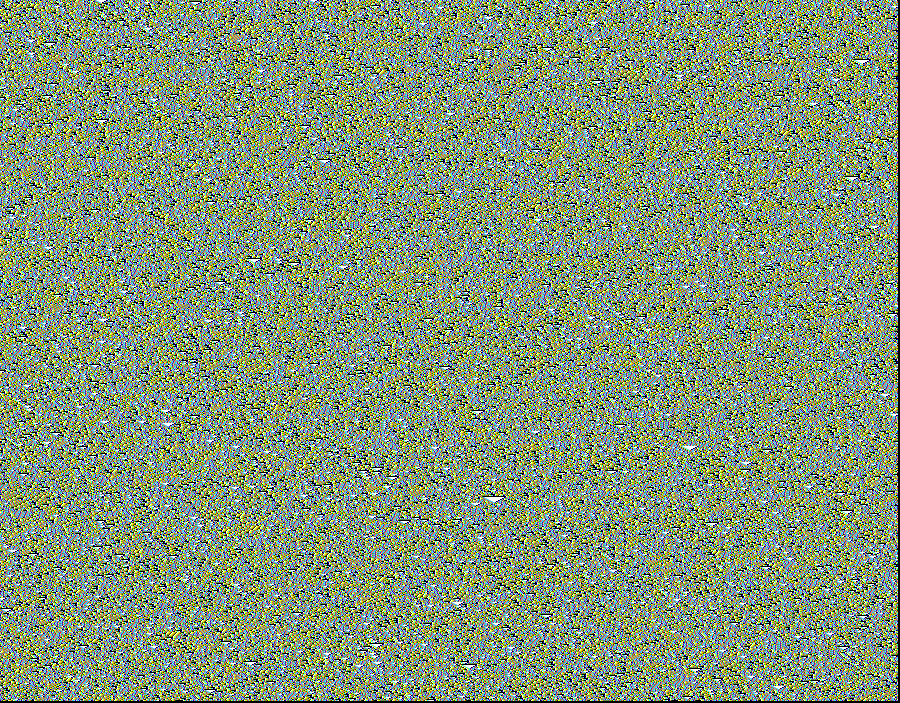
DISORDER: space-time patterns, k5 rule 994a6a65, n=900
Basin of Attraction Fields: Order-Complexity-Disorder
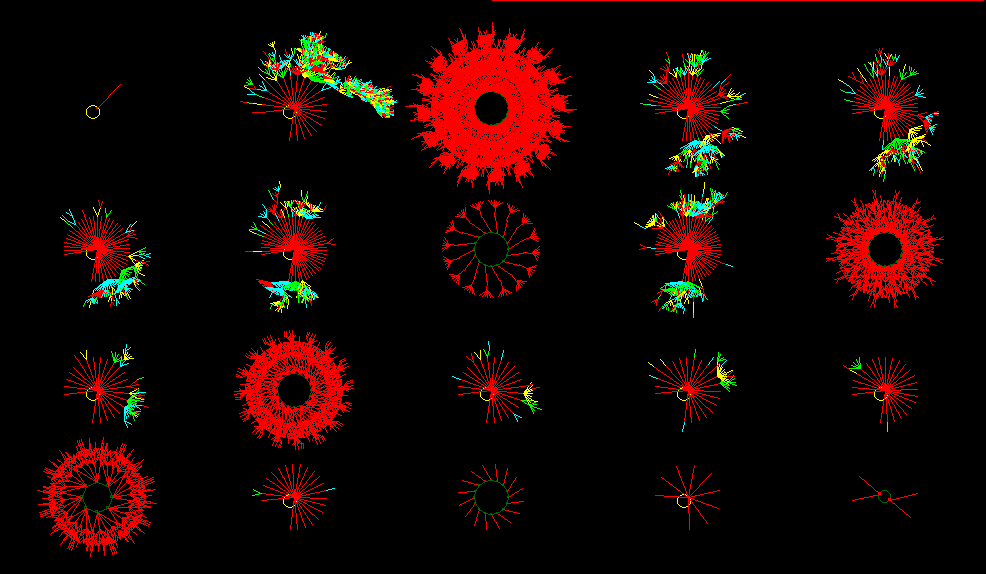
ORDER: basin of attraction field, n=16
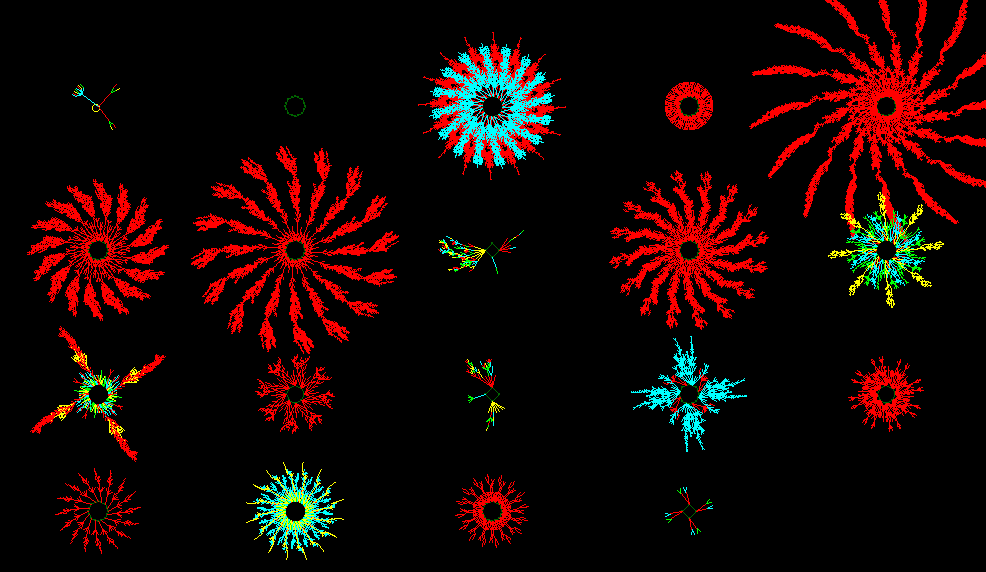
COMPLEXITY: basin of attraction field, n=16
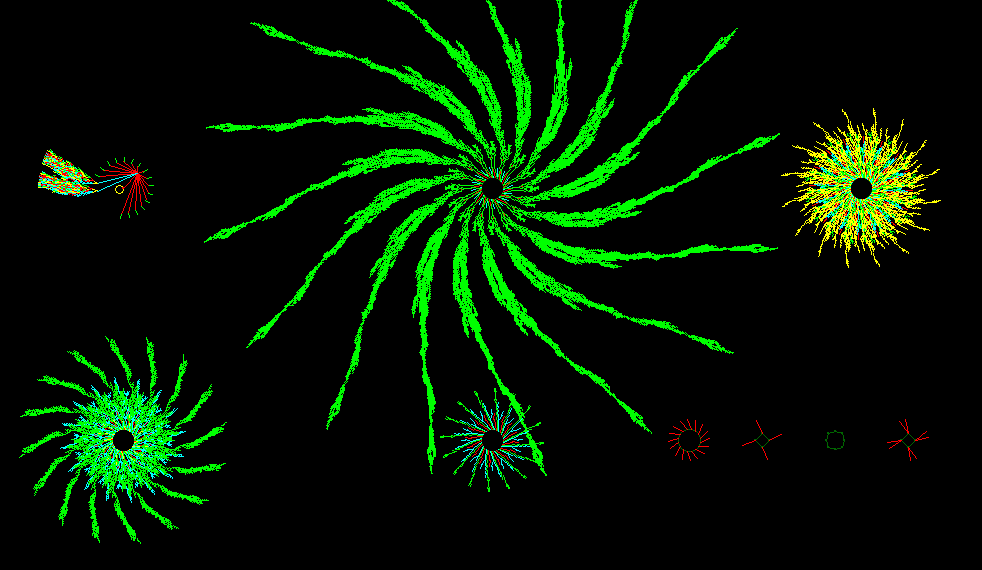
DISORDER: basin of attraction field, n=16
Basin Sub-Tree Portraits: Order-Complexity-Disorder
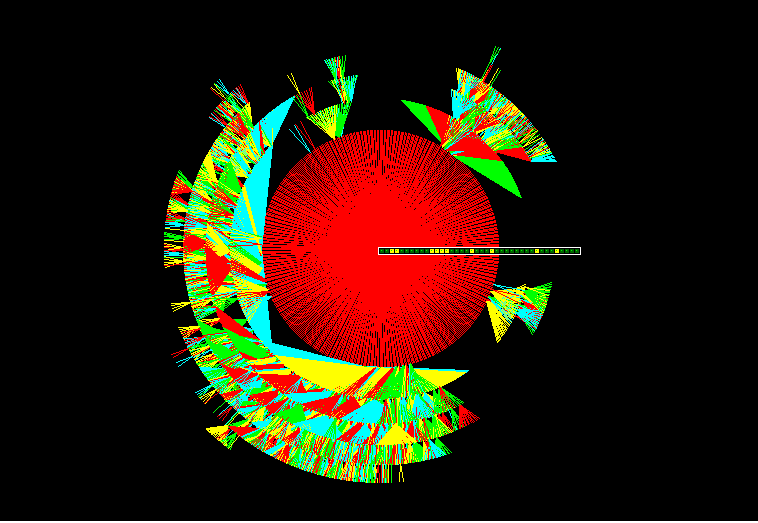
ORDER: subtree, n=40
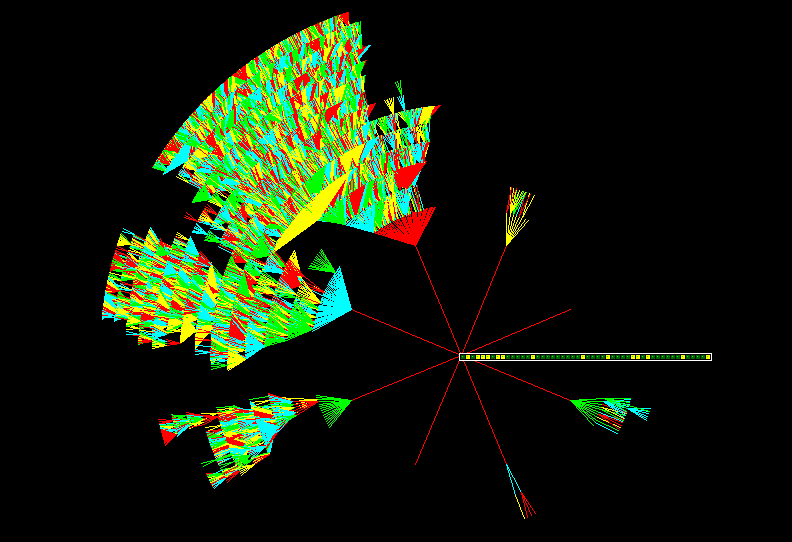
COMPLEXITY subtree, n=50
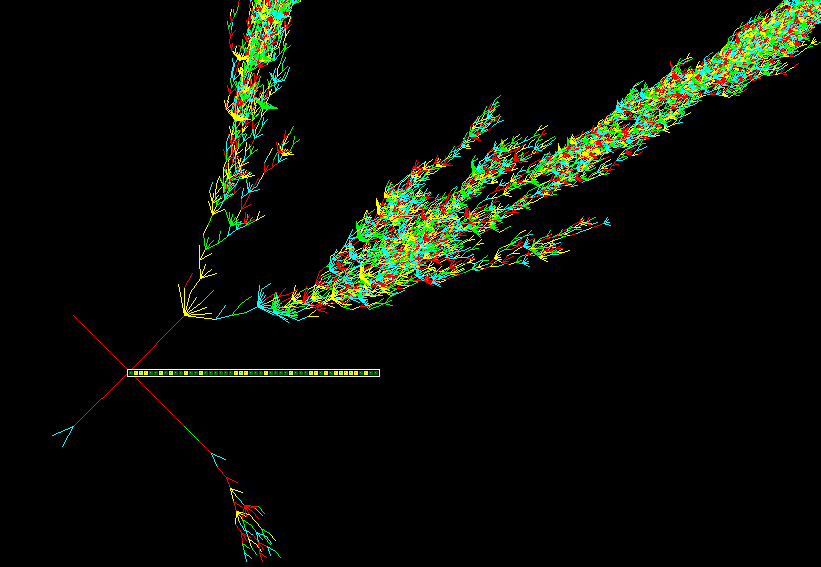
DISORDER: subtree, n=50
In-Degree Histograms: Order, Complexity, Disorder
Long History of a Small Universe
n=900, k5 rule 360a96f9
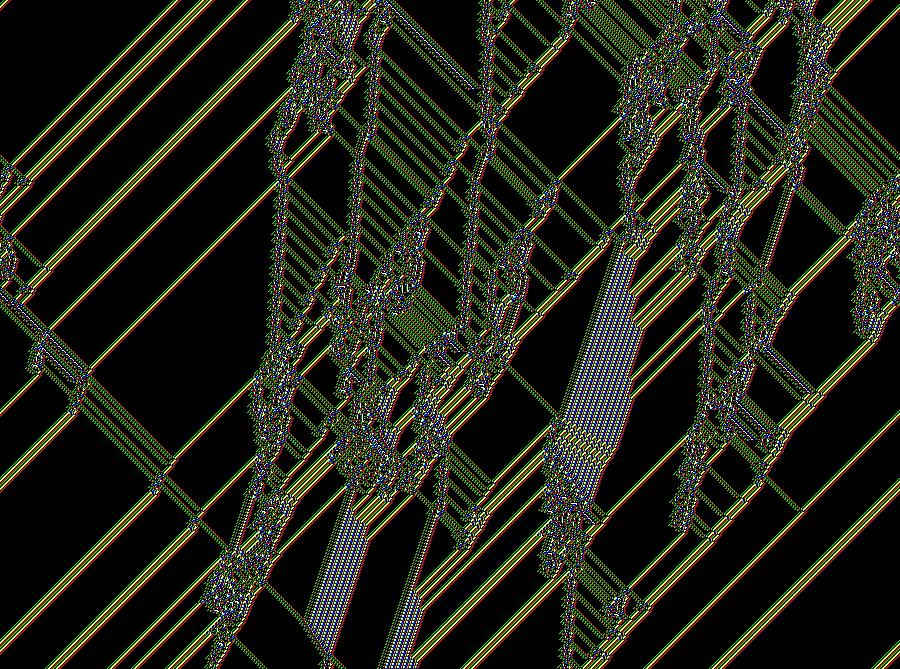
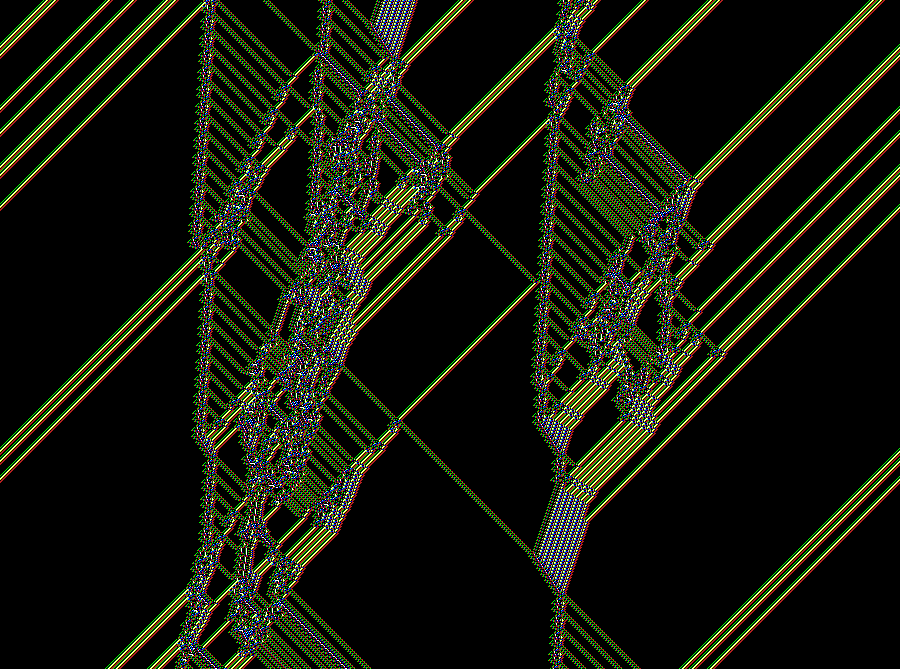
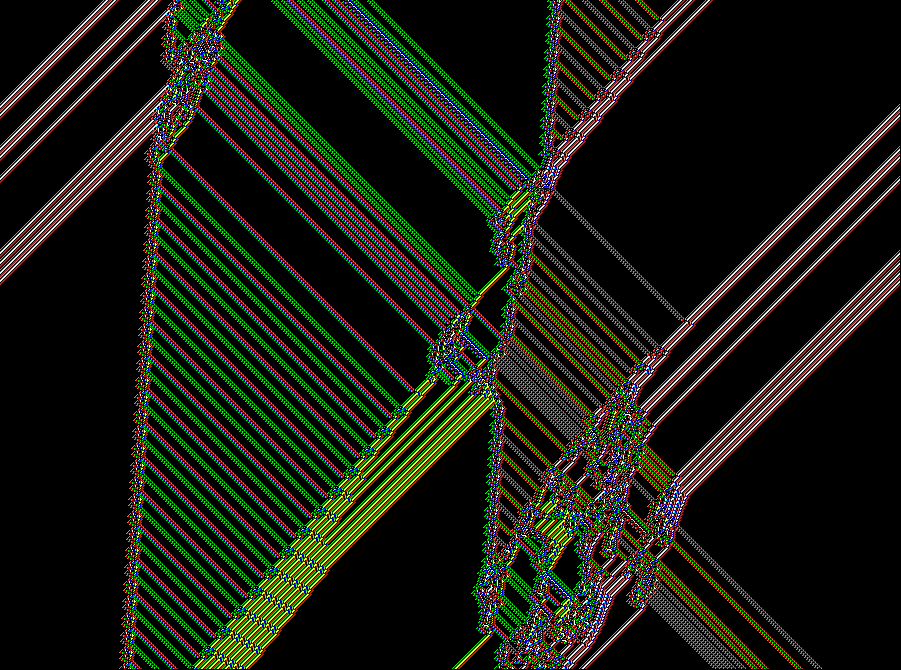
Complex CA Details
Various evolved complex space-time patterns
shown according to neighbourhood color, and filtered
n=150, 110 time-steps.
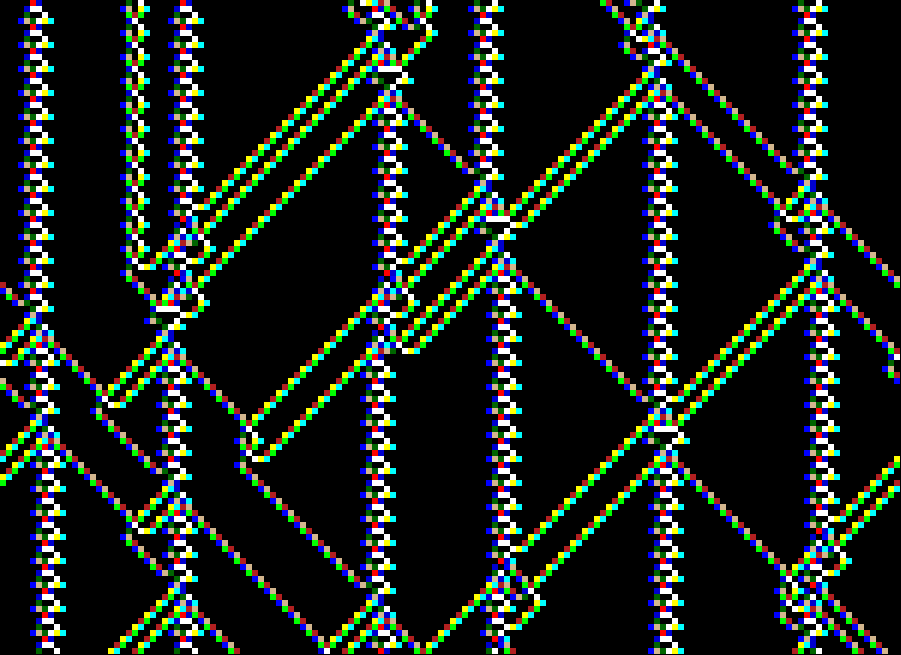
k3 rule 54
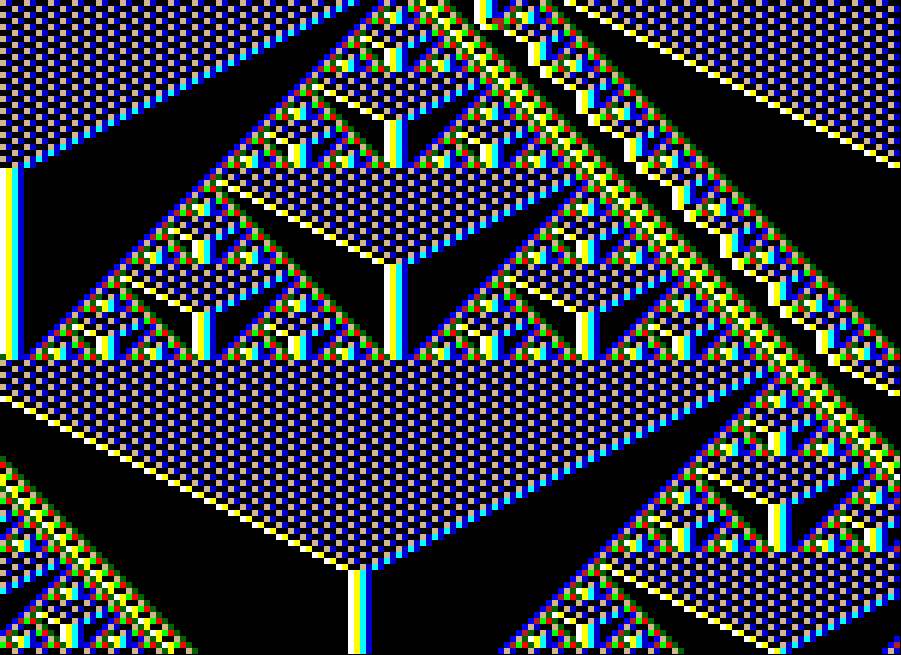
k5 rule c3bce390
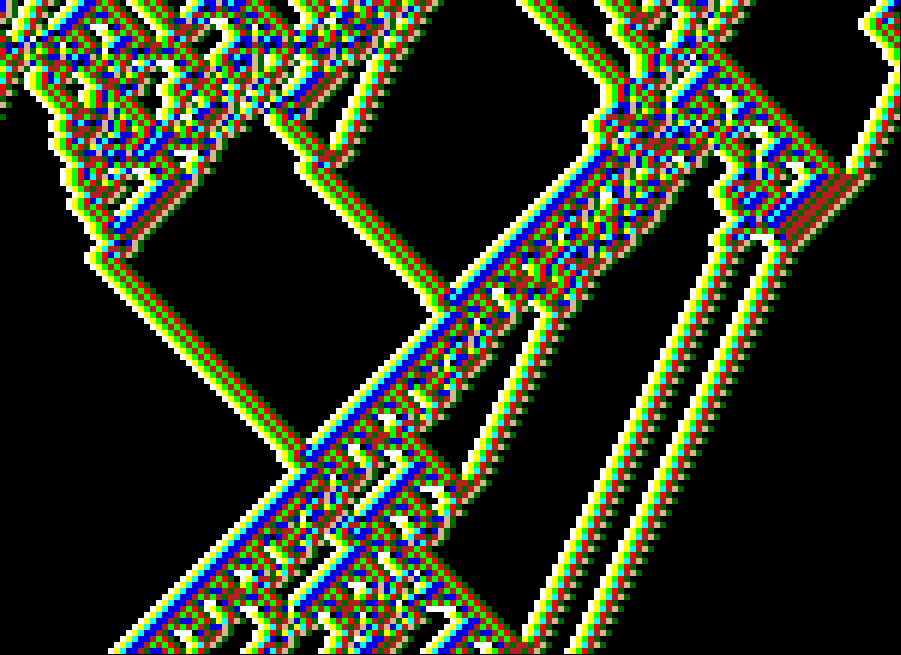
k5 rule 5c6a4d98
Basins of Attraction: Order-Complexity-Disorder
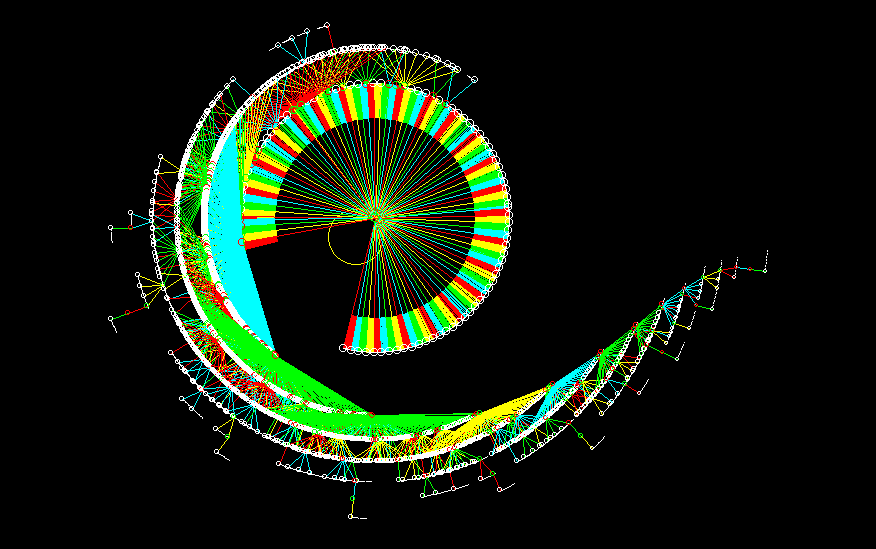
ORDER: basin of attraction (point attractor),
n=15, k3 rule 250, 32767 nodes, G-density=0.859
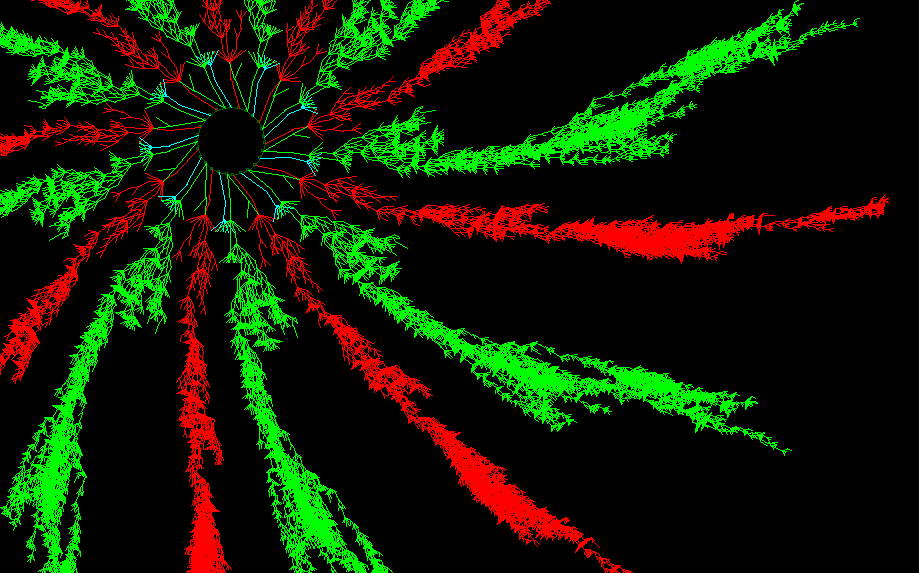
COMPLEXITY: basin of attraction, period 27
n=18, k3 rule 110, 93825 nodes, G-density=0.611
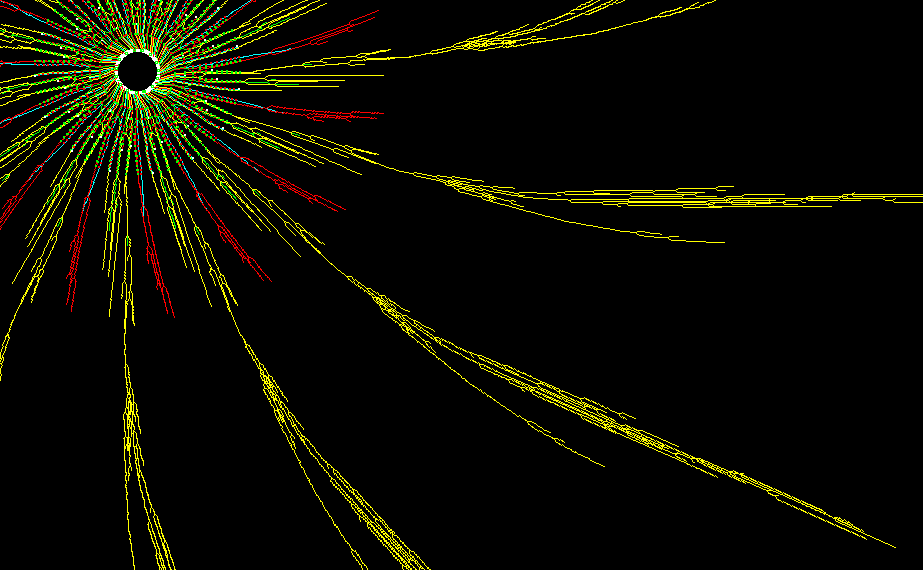
DISORDER: basin of attraction, period=1455
n=15, k3 rule 30, 30375 nodes, G-density=0.042, longest transient=321 time steps
Complexity in Small Universes
the exhibit description.
Some more closeups of complex CA
Various evolved complex space-time patterns
not included in the exhibition
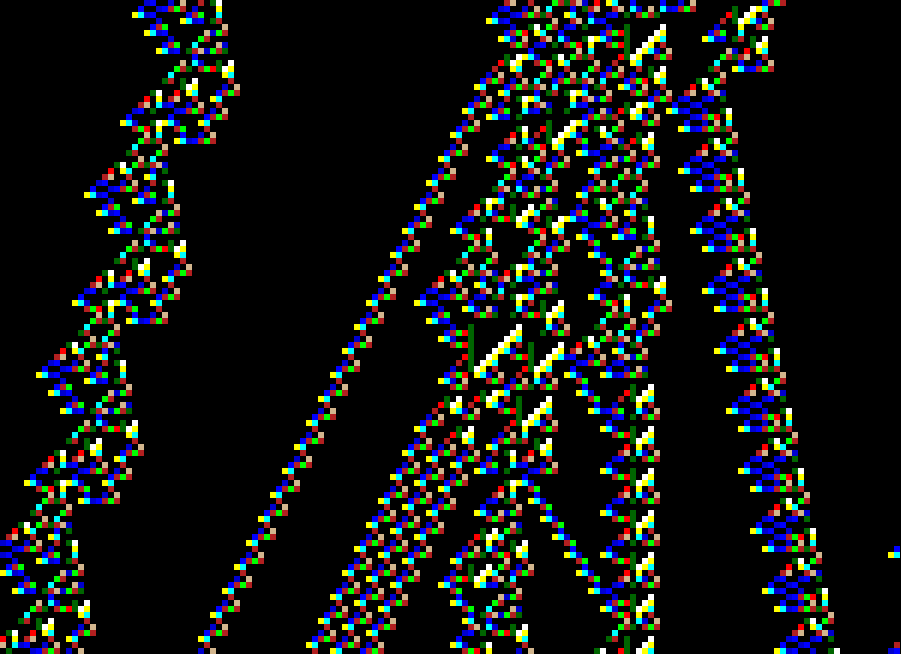
k3 rule 110
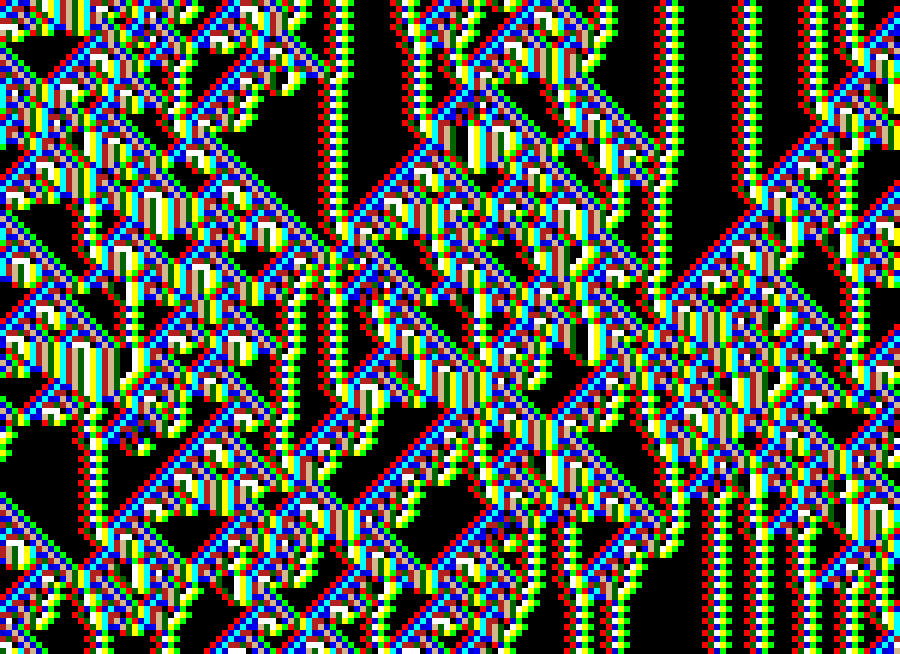
k5 rule 3a48b5c4
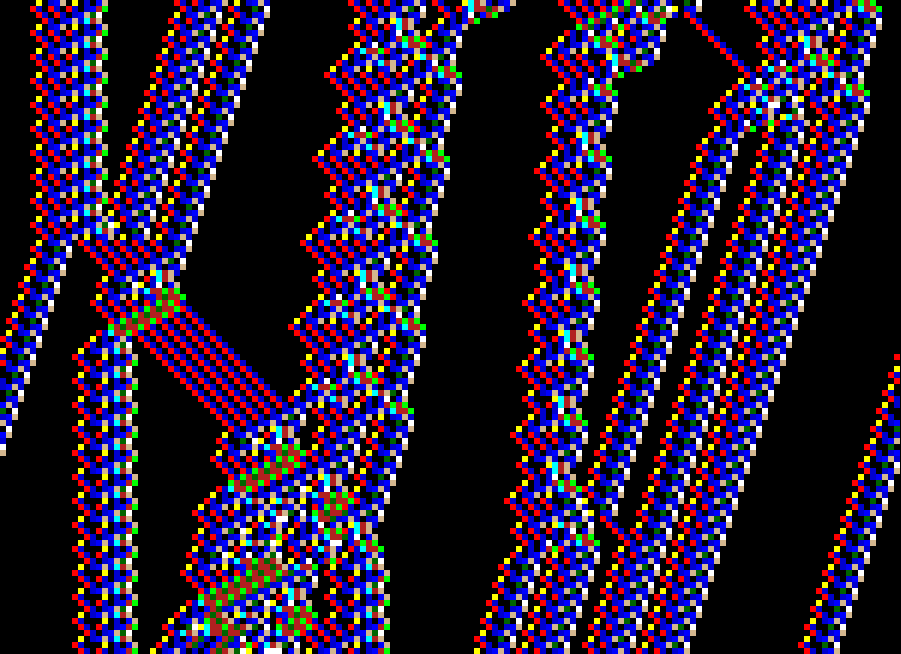
k5 rule 49a9bfe1
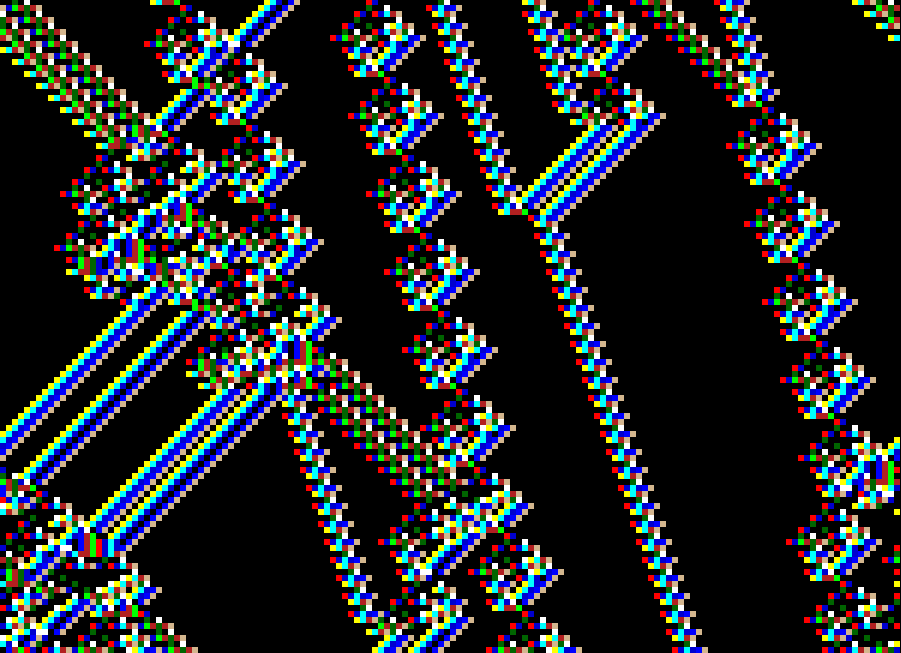
k5 rule 60b1c4ae
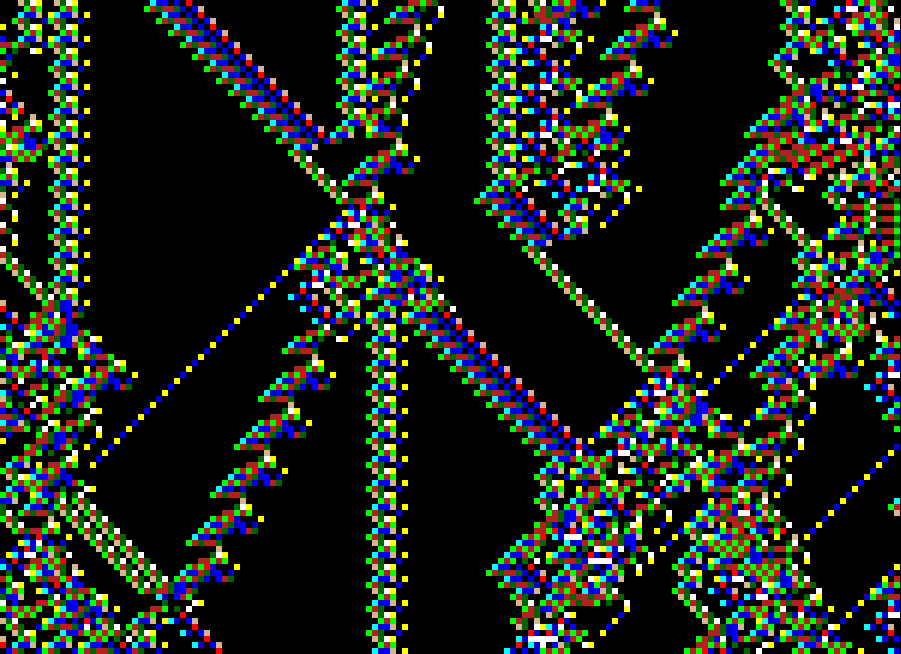
k5 rule 988d663c
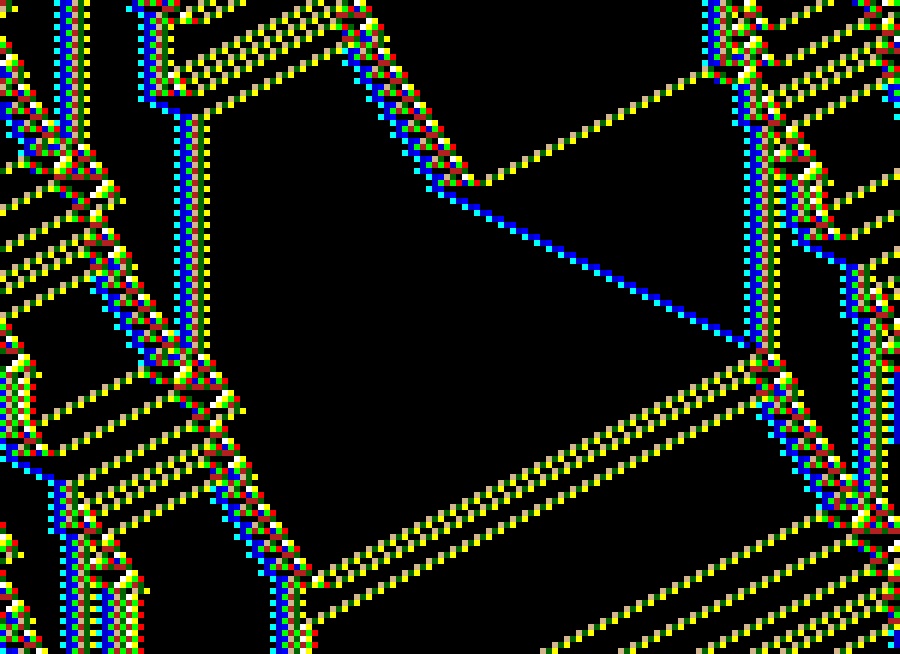
k5 rule d28f022c
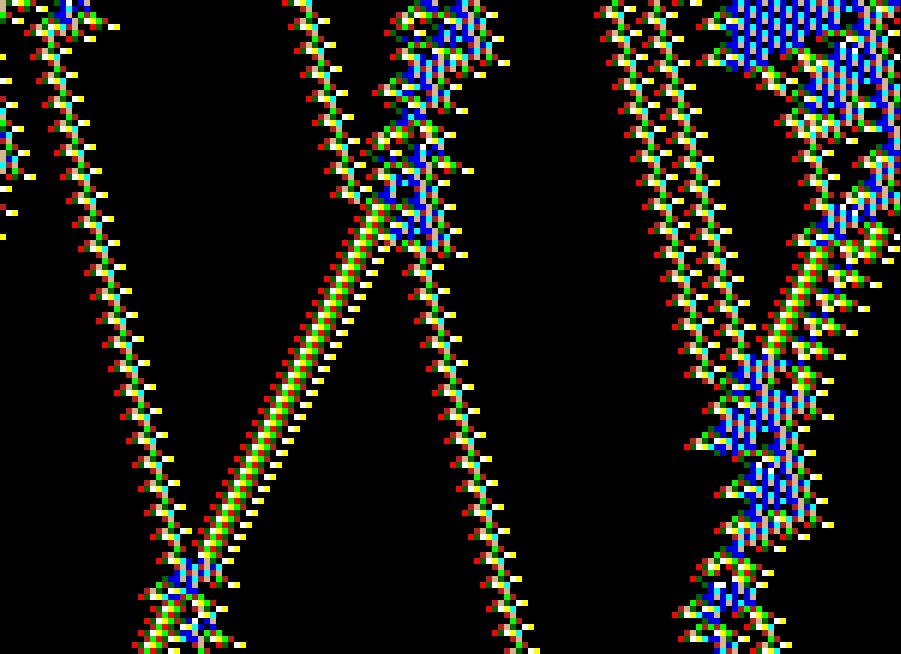
k5 rule da0a431b
back to the start
back to the DDLab home page,
DDLab Gallery
Last modified: July 2003