Discrete Dynamics Lab

Update September 2024 ddlabz12

is documented in this updated hyperref .pdf book (EDD) ExploringDiscreteDynamics‑updateSept2024
This is an updated version of the paperback Exploring Discrete Dynamics, Second Edition, 2016, Luniver Press -- available at Amazon-UK, Amazon-USA, and other online book sellers.

This Sept 2024 update (following the Sept 2023 update) includes a new toggle between the "wiring graphic" and the "interactive-graph", and some improvements and bug fixes, including ...

  • Directly accessing the interactive network-graph from the wiring graphic, allowing toggling between the two.
  • Inprovements to "Labels at nodes" for interactive graphs.
  • Various edits to EDD 2024 especially chapter 20, also "The Derrida Plot" section 22.7, and "The wiring grphic" section 17.4.
  • An new arXiv paper "Interactive Graph Visualization in DDLab" is available, to appear in "Advances in Cellular Automata", eds. Adamatzky et al, Springer.
toggling between the "wiring graphic"and the "network=graph" 3d 9x9x9. Each cell has one input (k=1) which are randomly assigned. As a network-graph all drag/drop and other functions apply as usual.
DDLab has been updated at regular intervals since its release in 1995. Its precursor was the Atlas software included on diskette inside the back cover of "The Global Dynamics of Cellular Automata" 1992.
Click here for a list and downloads of this and older versions,
and EDD-Sept2024 for the latest manual.
Below are links to previous updates,

Sep 2023 (EDD2ndEd-update)
xFeb 2021 (EDD2ndEd-update)
xxNov 2018 (EDD2ndEd-update)
xxxJan 2018 (EDD2ndEd-update)
xxxxMarch 2017
xxxxxMay 2016 (EDD2ndEd)
xxxxxxSept 2015
xxxxxxxMay 2013
xxxxxxxxJan 2013
xxxxxxxxxJune 2012 (EDD)
xxxxxxxxxxNov 2005
xxxxxxxxxxxDec 2003
xxxxxxxxxxxxJuly 2001 (Manual2001)
xxxxxxxxxxxxxxxFeb 1999
xxxxxxxxxxxxxxxxSept 1997

To learn more see EDD chapter 20 (click for an immediate look), or the complete EDD book, and experiment with DDLab.
Download compiled versions of ddlabz12 for Linux, Mac, Cygwin, DOS. The ddlabz12 source code is available, including Makefiles, readme, GNU license, and notes.
Click figures to enlarge. #x.x.x refers to the relevant Section (or Figure x.x/Table x.x) in the latest EDD.


network-graph from wring graphic, and toggling between

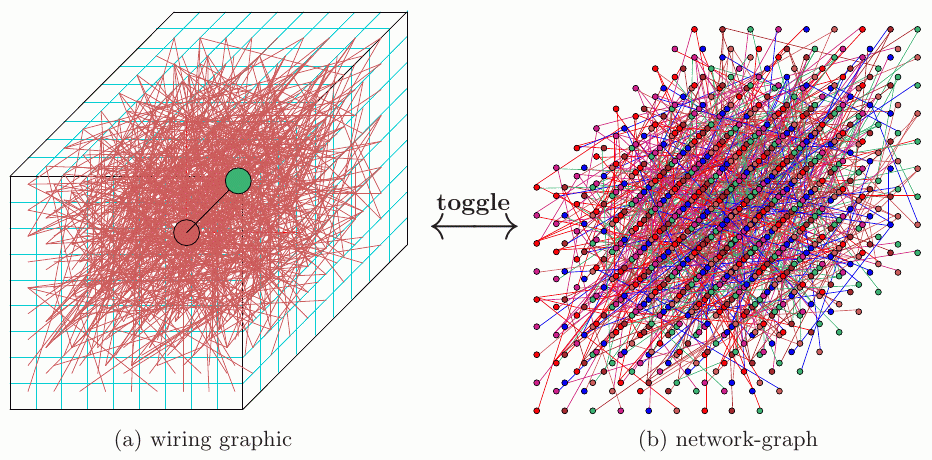
The interactive "network-graph" (#20.1) can be directly accessed from the "wiring graphic" (#17.4) allowing toggling between the two. Note that the ``wring graphic'' has its own distinct and different interactive options to review and amend network architecture (#17) including (pseudo) neighborhoods and rules, whereas the network-graph (#20.5) can manipulate the visualisation by drag/drop and many other functions.

A new option graph-g is added to the (1d, 2d or 3d) wiring graphic reminder (#17.4) to activate the network-graph --- then the option win-w showing what was ``below'' the graph window provides a useful toggle between the two presentations (#20.21). To resolve conflict, the wiring graphic option that was all-g is now changed to all-a

To test, from any wiring graphic, enter g for the following preliminary top-right prompt no links-N, show links-def:

Enter return to launch the network-graph with links, or N without links. After an interval to compute, the network-graph and its iniitial reminder will appear, including the prompt win-w -- enter w to toggle back to the wiring-graphic, then repeat to toggle back and forth between the two without the need to recompute. Note that win-w is only active in the wiring-graphic initial-reminder. In the wiring-graphic there is a top-right inset "restore graph -any key", so key w or any other key will work. The network-graph remains in control and all its functions can be exercised while its visible. To exit the network-graph and reactivate the wiring-graphic, enter quit-q from the initial reminder.

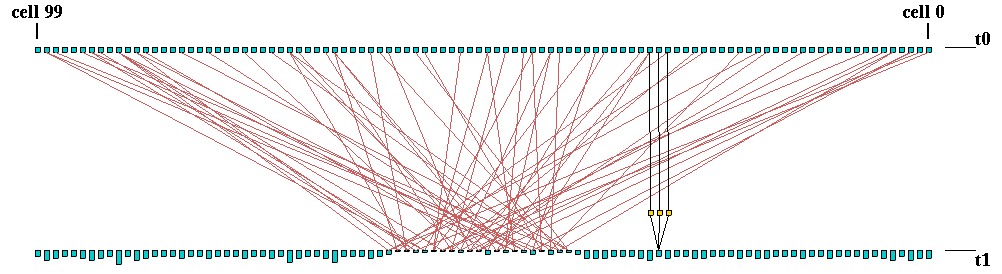
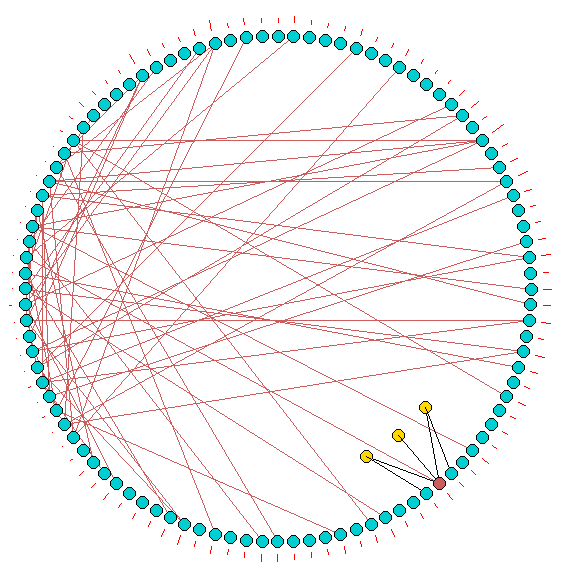
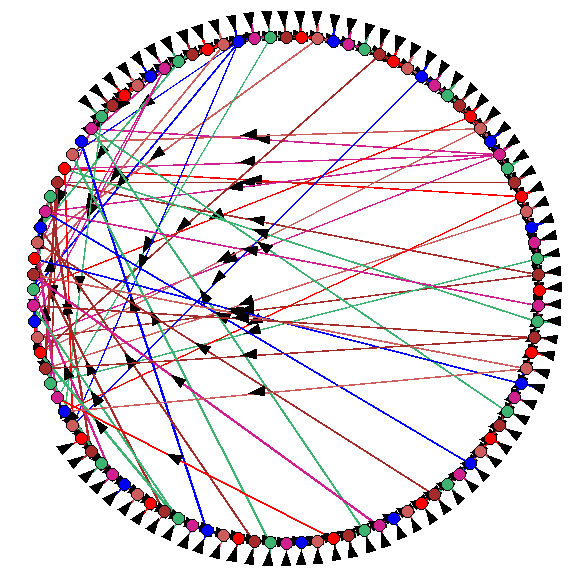
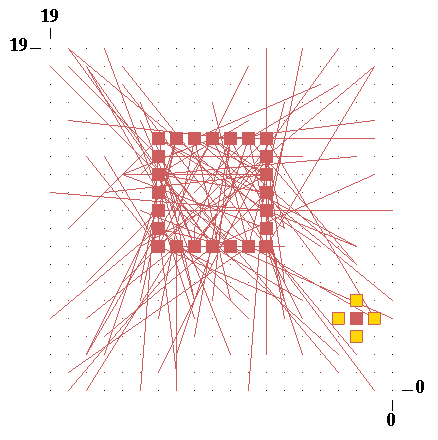
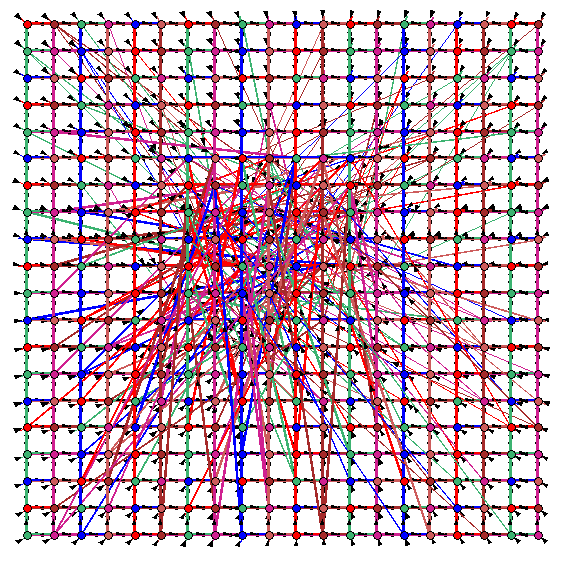
The 1d and 2d examples below are for regular CA wiring but with a central block where the wiring was randomised in the wiring-graphic, shown left ---its equivalent network-graph shown right. An example for 3d is shown at the top of the page.

1d wiring graphic #17.6


1d wiring graphic --- between time-steps, showing a "block", and one selected cell.
1d wiring graphic --- in circle layout, showing a "block", and one selected cell.
equivalent network-graph #20.5


Left A CA 1d network n=100 k=3 but with the wiring of a block of cells, 40-60, randomised. A 1d wiring graphic can be shown eather according to time-steps, or in circle layout. In both cases the (pseudo) neighborhood and wiring of a selected cell is displayed.

From either wiring graphic, graph-g computes and launches the corresponding network-graph (above) --- a circle layout is the default --- then the two can be togged with win-w.

2d wiring graphic #17.7


2d wiring graphic,, showing a "block", and one selected cell.
equivalent network-graph #20.5


Left A CA 2d network n=20x20 k=5 but with the wiring of a central block of cells, 7x7, randomised, showing all inputs to the block, which is demarcated by its edge cells. The (pseudo) neighborhood and wiring of a selected cell is displayed.

From the wiring graphic, graph-g computes and launches the corresponding network-graph (above) --- a 2d layout is the default --- then the two can be togged with win-w.

Labels at nodes --- single status, Label-L/+
inprovements to "Labels at nodes" for interactive graphs:
to see current node display with leading linebreak-'\'

#20.12 (click for an immediate look)

Arbitrary labels of up to 90 characters and multiple lines can be made at graph nodes to overwrite the current automatic node display. This is done from the drag-graph in 'single:' status where "Label-L/+" appears in the drag-reminder --- enter "L" to set a label overwriting the active node, unless a leading linebreak-'\' is entered. Existing labels are toggled on/off with "+" (plus key) in any situation including the initial-graph which inherit labels from the drag-graph. Non-labelled nodes are displayed as usual and toggled with key "=". The following top-right prompts appear,

node=287 (0-1024) Label:empty (for example)
accept-ret, new-n:n enter new Label max 90 charsno (if 'new-n' was selected)
back-backspace, linebreaks-'\', complete/exit-ret (reminder notes)
(flashing cursor for input appears here)

Left: An example of a single ibaf basin, nodes/links unscaled. Some arbitrary labels were created, overwriting the current node display, but a leading linebreak/s- '\' or spaces will keep the current node display visible, which can still be toggled (key "=") for single nodes or fragments --- for example the subtree to state 81 has been toggled to show all its inputs as numbers, and to state 216 as 2d patterns. The same label methods apply for the network and jump graphs.

Return to the Discrete Dynamics Lab home page.
Last modified: Sept 2024